Arghandab Integrated Water Resource Management Project – Afghanistan
Decades of war and political instability have decimated most of Afghanistan’s water infrastructure and reduced the technical capacity of the water resources sector.
In response, the Government of the Islamic Republic of Afghanistan is undertaking a range of initiatives to invest in new infrastructure, improve water resource management and increase capability. One such initiative is the Arghandab Integrated Water Resource Management Project.
The Asian Development Bank (ADB) is supporting the Afghanistan Government to scope the Arghandab Integrated Water Resource Management Project. The project will finance infrastructure to increase water resources for irrigated agriculture, urban water supply, and power generation for Afghanistan’s second largest city Kandahar and surrounding areas.
Using Source to support infrastructure investment
eWater was invited to provide technical assistance to the project, through a rapid hydrologic study of the Arghandab River and capacity building through training in the use of the Source modelling platform. eWater’s involvement was funded by the Australian Department of Foreign Affairs and Trade (DFAT).
eWater, in collaboration with modellers in Afghanistan built a baseline Source model for the Arghandab River Basin. The model is used to generate inflows to Dahla Dam for the period 2002 to 2016.
The model allows different multi-sector allocation scenarios for irrigation, urban water supply, hydropower and downstream flows to be compared against each other, providing key inputs to support the decision-making process. The potential impacts of climate change on the different options is considered by modelling different inflow scenarios.
Overcoming data constraints
Water models typically rely on observed measurements for flow, rainfall, evaporation etc. However, such data is very limited in Afghanistan. A combination of data from historic sources and remotely sensed sources were evaluated and used to develop the Source model. The hydrology is simulated using the GR4J and GR4JSG hydrological models which, respectively, represent direct rainfall-runoff and snow melt processes. The hydrology is calibrated to historic average monthly observed values.
Given that this is a rapid study where limited time is available to explore alternate sources of data such as some of the globally generated flow sequences used for detailed climate change modelling, an expedient approach to calibrating the model was adopted. This was to assume stationarity in average monthly flows and calibrate to observed monthly average discharge values despite differences in dates between rainfall and discharge. This averaging impacts on the predictive ability of the model for extreme events such as flash flooding associated with sudden high rainfall since extreme peaks in flows can happen at a sub-monthly scale.
Nonetheless, the model significantly increases the information available to water managers to understand current flows and support initial investigations into the impact of changes in dam size and demand over time and with climate change. Examples of the model outputs are shown below.
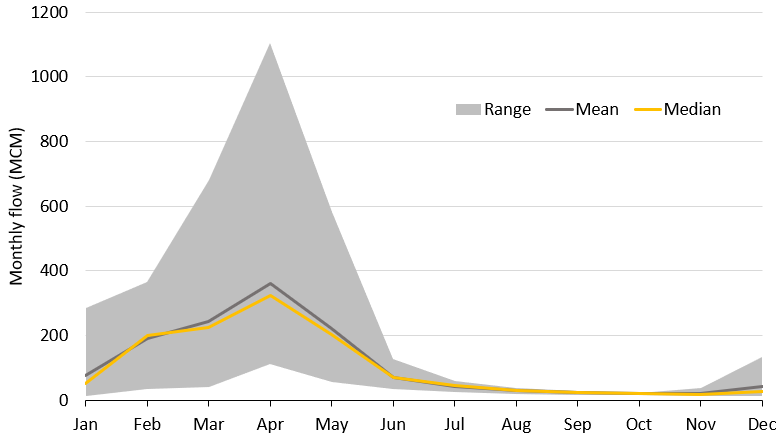
Monthly flows
Flows are highly variable, particularly during the wet season. Monthly flows are lowest in October and November, and highest in April. The figure below shows the possible range in total monthly flows predicted by the Source model, with the grey area representing modelled minimum and maximum flows for each month. The modelled period 2002 – 2016 includes the drought years of 2010 2016 as well as extreme flows observed in 2007. Mean and median flows are also indicated.
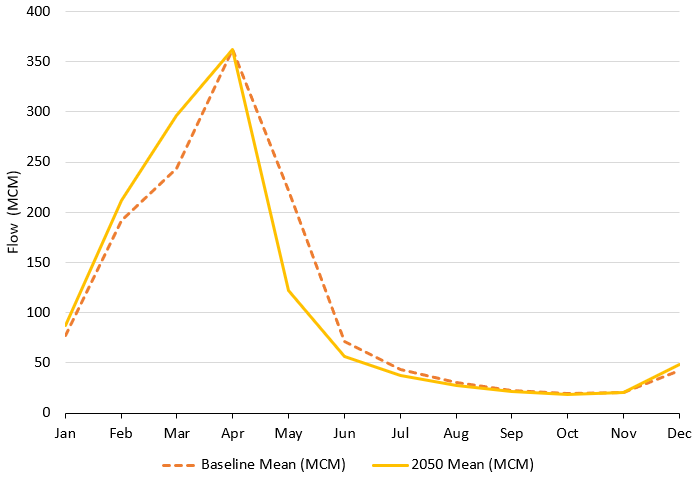
Impact of climate change on flows
The projected impact of changes in temperature and rainfall on average total monthly inflows to Dahla Dam, between the baseline period (2002 – 2016) and future 2050 are illustrated in Figure X. Expected higher temperatures will cause snow to melt sooner in the season with an increase in flow in March and less water available from May resulting in a longer low flow season.