Strengthening Water Resources Management in Afghanistan

The Strengthening Water Resources Management in Afghanistan (SWaRMA) project is a two year collaboration between the governments of Afghanistan and Australia through the CSIRO.

eWater, in collaboration with the CSIRO has supported the initiative through:

  • Developing a Kabul Basin Model.
  • Developing a Whole-of-Afghanistan water availability model.
  • Capacity building in water resource modelling with eWater Source.
Panjshir valley in Eastern Afghanistan (credit:mbrand85/AdobeStock)

Kabul Basin Model

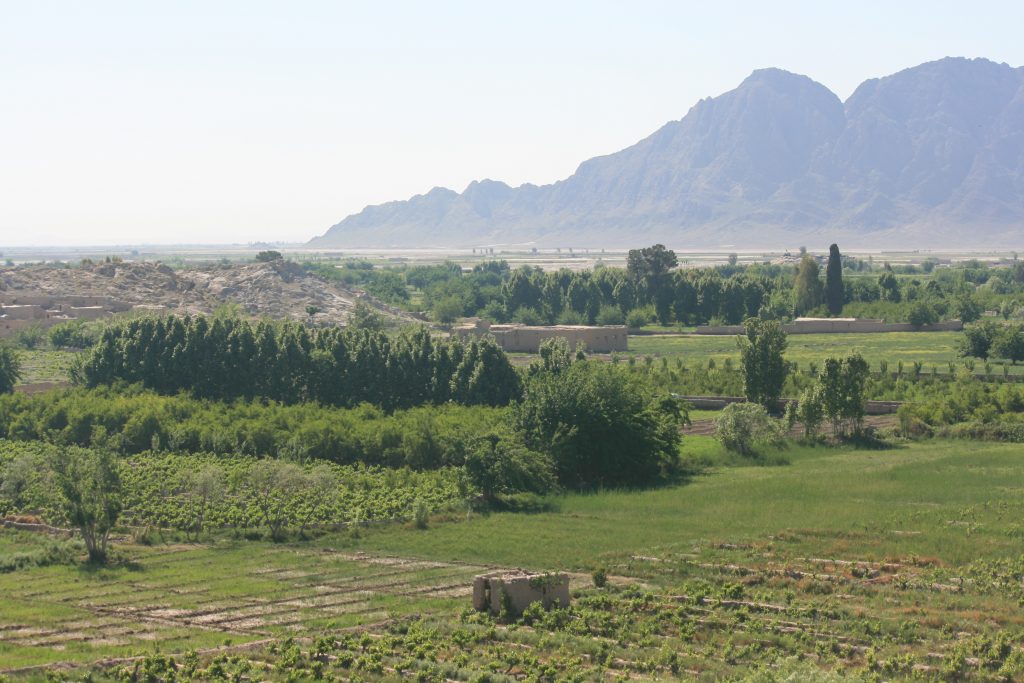
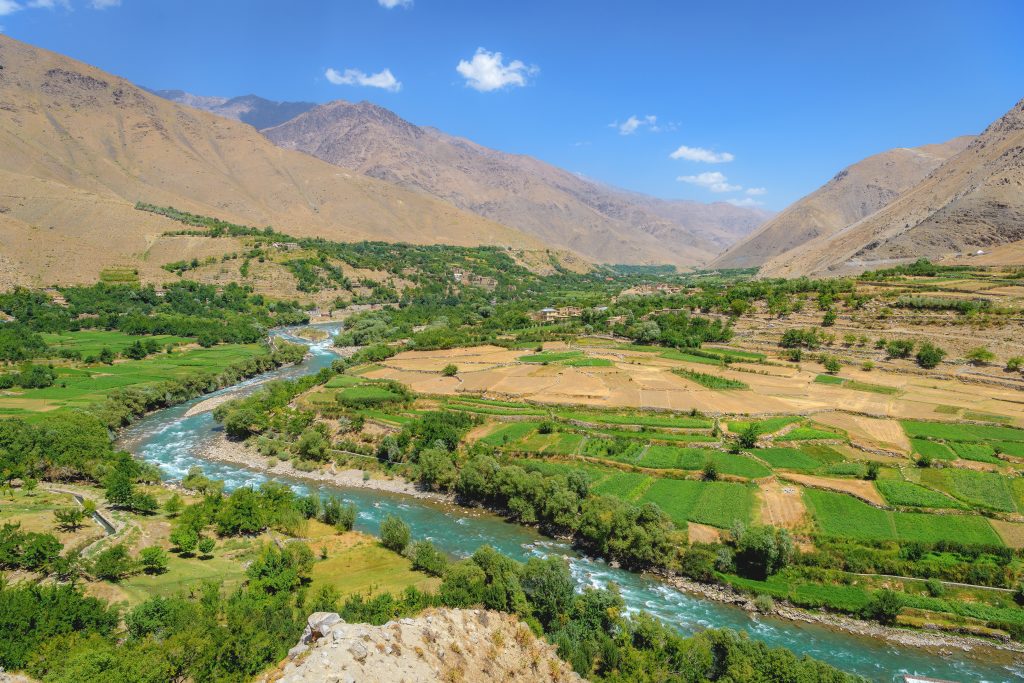
The Kabul River Basin is located in Eastern Afghanistan. It joins the Indus River in neighbouring Pakistan. Most inflows are generated from snow melt in the sub-basins of the Panjsher and Konar rivers, which are located high in the Hindu-Kush mountains, with their heavy snowfalls and many glaciers. The catchment is largely undeveloped, with only 6% of land used for cropping (FAO, 2010) and 1% urban. Kabul City is the largest urban area with a population of 4 million.

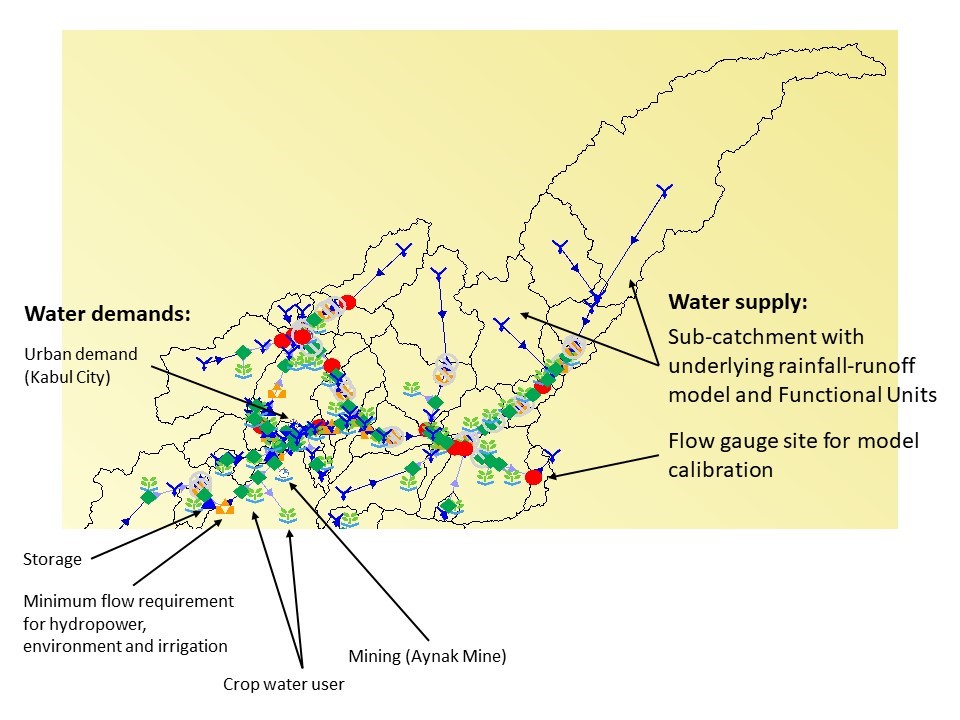
The model includes water demands for irrigated cropping, urban water, hydropower and the expected water demand from the Aynak mine. Minimum flow requirements are included to meet environmental needs. Urban demands are only modelled for Kabul City, as it is the only urban demand large enough to have an impact on downstream water supply. After consultation with the Ministry of Energy And Water (MEW), demands for Kabul were estimated as 120 L per person per day. Water demand on groundwater is factored into water use for Kabul City, since it is known that over time the reliance on groundwater for Kabul City will change to using surface water from the proposed Shatoot and/or Gulbahar dams. The model is conceptualised to provide for this change in the future.

The Source model for the Kabul Basin provides a broad scale representation of the Kabul River basin and its key water demand and supply elements. It serves as a tool for capacity building, including demonstrating the use of models to assess different water management scenarios. The model is not currently intended to be applied as an operational model of the system. However, it has been conceptualised to provide a framework representing the key features which can be extended with further information regarding management rules and requirements. 

This model has been handed over to the Ministry of Energy and Water, so they can continue to develop the model and use it to more detailed analysis and water resource planning and management. 

Integrated Source model for the Kabul River Basin

Rapid assessment of whole of Afghanistan water availability

The Source platform makes it possible to explore water availability across multiple scales, from the scale of sub-catchment tributary to major river basin scale to the whole country. A whole of Afghanistan Source model was built to undertake a rapid assessment of water availability in Afghanistan’s five major river basins. Due to limited historical data, the assessments were based on daily global data inputs for the period 2006-2016 and long-term monthly average flows from pre-1980.

Afghanistan is a land locked country and shares its river basins with its neighbouring countries. The use of global input sets helped overcome potential issues of sourcing this data from these other countries. However, a lack of available observed flow sites within these countries meant that neighbouring flow contributions could not be calibrated.

Due to lack of observed flows, it was only possible to calibrate against historical average monthly flows. As such the model can only be considered to represent long-term average conditions across Afghanistan and can only give an indicative assessment of water availability. In time, the model can be further developed as data and knowledge improve.

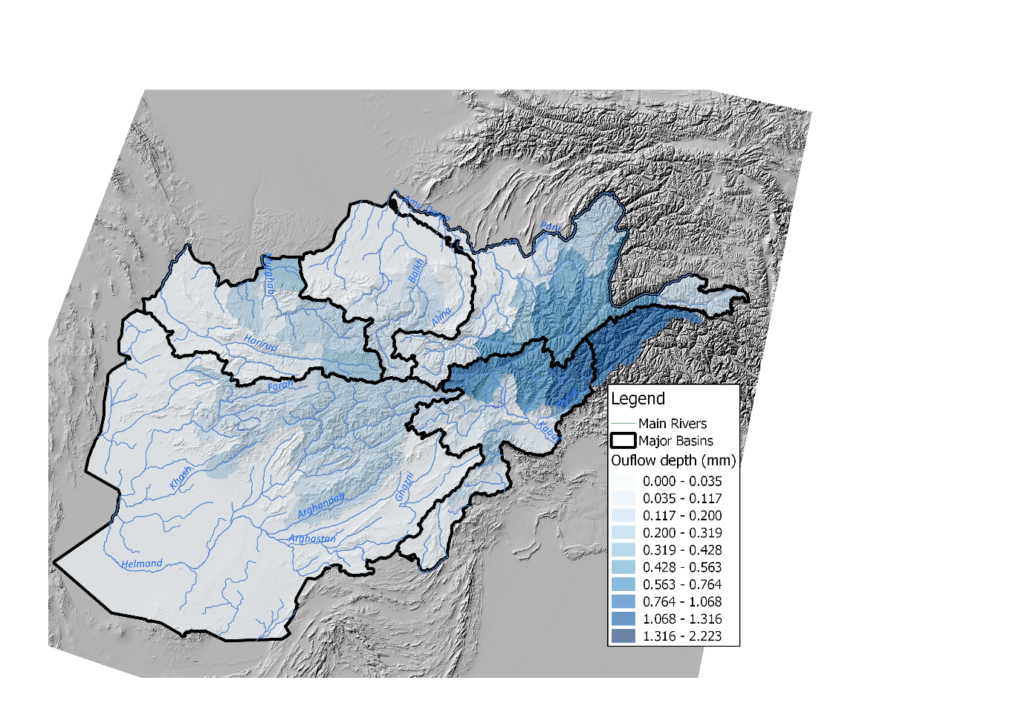
The rapid assessment provides a much needed baseline tool and information source for water managers. The figure below is an example of the outputs available from the model, it shows the area-weighted outflow per sub-catchment, providing an indication of the distribution of water availability across Afghanistan. It shows that the higher mountain areas are the main source of flows, particularly the Hindu Kush mountains, which receives significant snow in winter.

Area weighted outflows per sub-catchment in Afghanistan

References

FAO (2010) Land cover of the Islamic Republic of Afghanistan. Food and Agriculture Organization of the United Nationshttps://dwms.fao.org/~draft/lc_2010_en.asp (accessed 12/12/2018) 


Learn more about SWaRMA here


Arghandab Integrated Water Resource Management Project – Afghanistan

Decades of war and political instability have decimated most of Afghanistan’s water infrastructure and reduced the technical capacity of the water resources sector. 

In response, the Government of the Islamic Republic of Afghanistan is undertaking a range of initiatives to invest in new infrastructure,  improve water resource management and increase capability. One such initiative is the Arghandab Integrated Water Resource Management Project. 

The Asian Development Bank (ADB) is supporting the Afghanistan Government to scope the Arghandab Integrated Water Resource Management Project. The project will finance infrastructure to increase water resources for irrigated agriculture, urban water supply, and power generation for Afghanistan’s second largest city Kandahar and surrounding areas.

Farmland in Kandahar (credit Paul/AdobeStock)

Using Source to support infrastructure investment

eWater was invited to provide technical assistance to the project, through a rapid hydrologic study of the Arghandab River and capacity building through training in the use of the Source modelling platform. eWater’s involvement was funded by the Australian Department of Foreign Affairs and Trade (DFAT). 

eWater, in collaboration with modellers in Afghanistan built a baseline Source model for the Arghandab River Basin. The model is used to generate inflows to Dahla Dam for the period 2002 to 2016. 

The model allows different multi-sector allocation scenarios for irrigation, urban water supply, hydropower and downstream flows to be compared against each other, providing key inputs to support the decision-making process. The potential impacts of climate change on the different options is considered by modelling different inflow scenarios. 

Overcoming data constraints

Water models typically rely on observed measurements for flow, rainfall, evaporation etc. However, such data is very limited in Afghanistan.  A combination of data from historic sources and remotely sensed sources were evaluated and used to develop the Source model. The hydrology is simulated using the GR4J and GR4JSG hydrological models which, respectively, represent direct rainfall-runoff and snow melt processes. The hydrology is calibrated to historic average monthly observed values.

Given that this is a rapid study where limited time is available to explore alternate sources of data such as some of the globally generated flow sequences used for detailed climate change modelling, an expedient approach to calibrating the model was adopted.  This was to assume stationarity in average monthly flows and calibrate to observed monthly average discharge values despite differences in dates between rainfall and discharge. This averaging impacts on the predictive ability of the model for extreme events such as flash flooding associated with sudden high rainfall since extreme peaks in flows can happen at a sub-monthly scale. 

Nonetheless, the model significantly increases the information available to water managers to understand current flows and support initial investigations into the impact of changes in dam size and demand over time and with climate change. Examples of the model outputs are shown below. 

Monthly flows

Flows are highly variable, particularly during the wet season. Monthly flows are lowest in October and November, and highest in April. The figure below shows the possible range in total monthly flows predicted by the Source model, with the grey area representing modelled minimum and maximum flows for each month. The modelled period 2002 – 2016 includes the drought years of 2010  2016 as well as extreme flows observed in 2007. Mean and median flows are also indicated.

Shows the total modelled monthly inflows to the Dahla Reservoir (2002 – 2016). Flows start increasing in December, peaking in April. Flows start falling through June and July, with virtually no flow from August to November.
Range in total modelled monthly inflows to the Dahla Reservoir (2002 – 2016)

Impact of climate change on flows

The projected impact of changes in temperature and rainfall on average total monthly inflows to Dahla Dam, between the baseline period (2002 – 2016) and future 2050 are illustrated in Figure X. Expected higher temperatures will cause snow to melt sooner in the season with an increase in flow in March and less water available from May resulting in a longer low flow season.

Average total monthly flow volumes (Baseline 2002 – 2016 and 2050)